

#22 How do I set my revenue goal for the year?
Most of the time people respond to this question with a 10% or 20% increase from the previous year but we need to know where that revenue growth is going to come from and when we project it coming. Meaning in what quarter.
There’s a spreadsheet I made for you that goes with this blog and podcast. Enter your information below and it will be emailed to you. After you hit submit, you’ll be redirected right back to this page. Then, open your email and pull the spreadsheet up while you’re reading the rest of the directions!
Revenue can increase or decrease because of many factors but the most objective are:
Hiring can increase revenue with a short term financial investment at first that goes to training the new hires.
Price increases can increase revenue
Turn over can decrease revenue
We’re going to gather some data first and make some projections with the intent to see how much we can profit by the end of the year.
First, we need to know the average of our expenses. You can either get in your monthly P&Ls if your accountant or bookkeeper sends those to you and if they don’t I highly recommend this be something you put in place as soon as possible. If you don’t have monthly P & Ls you can either get in Quickbooks and run a monthly P&L report for every month last year or use your Bank statements.
Step 1
Gather your expenses for the year. Things like:
All your subscriptions
Rent
Utilities and Internet
Education
Team celebrations or gifts
Any benefits like PTO or insurance
And Repairs or maintenance
Marketing and Promotions
Don’t include Payroll and Inventory yet.
At the top of the Spreadsheet fill in the yellow cells with your total Revenue for last year and how much you spent on Expenses.
Sheet Explanation
Then we have to factor in Payroll, including the owners pay and Inventory, also known as “Cost of goods sold”. These 2 are usually variable costs bc what we bring in for revenue depends on how much we spend. Well on payroll at least if you’re a commission salon.
Fill in how much you spent on total payroll including the owner’s pay and how much you spent on Retail Inventory and Professional back bar.
You’ll notice in the sheet, there are percentages next to the Expenses, Payroll and Inventory totals. This is so we can know how much they're projected to cost us so we can see a projected profit. You’ll also see when we’re finished that when you spend the same percentage of revenue on Expenses, Inventory and Payroll, your profit margin will stay the same, you may make more money but the margin will remain.
Lastly, and this is just so we can reference for this year’s profit goal, fill in your profit from last year. If you don’t know it, you can leave it blank and it won’t mess anything up but it’s nice to have it for comparison.
When you know your average monthly expenses, my payroll and inventory percentage, move on to….
Step 2
Start recording your Service Provider’s numbers. Go back to last year and see the total service sales and the total retail sales for each service provider for the quarter and those service providers should still be with the salon. Don’t include anyone who has left the company. You’ll fill those numbers in on the spreadsheet. And if you want to go the extra mile, add each service provider's Utilisation for the year.
I’m not taking any turnover from last year into consideration. We’re only looking at our existing team and if any guests stayed with the salon and are seeing another service provider, those numbers will show up in their quarterly retail and service sales. I’m also not going to take any price increases into consideration for this year because that gets really complicated to explain over a blog! But we will think about that in a minute!
Now that we have Q1-Q4 service and retail sales for each service provider. We move on to…
Step 3
Let’s think about hiring. Do you plan on hiring this year and if so, how many service providers? Be conservative with this. It’s better to be conservative with how many new hires in your projections than to be aggressive.
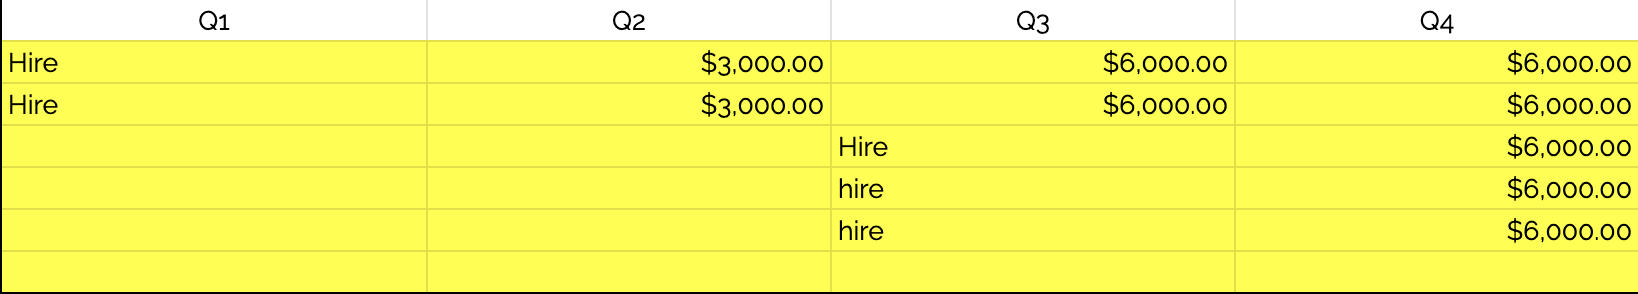
On the spreadsheet, there’s a chart for up to 6 new hires, if you want to hire more, add rows and if you want to hire less, you can hide the rows. You’re going to type the word “Hire” in for the quarters you want to hire each person in. We recommend hiring in clusters of at least 2 at a time because there are many benefits to this.
The quarter AFTER you hire someone, add in quarterly sales totals for their service and retail for the remaining quarters of the year. If you don’t know what to put:
Do you have any data in your software you can pull up and refer to one of your existing team members and what they did in the following quarters after they were hired? Pick someone who was hired in the last 1-2 years, an “average person” not one with a special case or talent that had incredible numbers, stay conservative.
If you don’t have any data, make an educated guess based on your new guest flow per month. You have to consider your Utilisation here bc some salons can have a new hire immediately producing $5k in sales the first month after training. Some may only do $500. So be reasonable here.
Example: So for me, I am hiring 2 new service providers in Q1. I’ll put the word “hire” in Q1 for the first 2 rows and for quarters 2-4, I will fill in what I think they can do in total sales, and I will be conservative. I also plan on hiring 4 new people in Q3. So in Q3, I will put the words “Hire” for the 3, 4 and 5th potential hires and in Q4, Ill fill in the total sales I think they can bring in!
At this point in
Step 1, you have your total expenses, payroll and inventory costs for last year
Step 2, you have your Service and Retail sales for each quarter for every service provider you currently have
Step 3, you projected new hires you plan on hiring in each quarter and filled in your projection for their total sales starting the quarter after they were hired.
We’re going to pause for a second, and this isn’t necessarily a step so I’m calling it 3 A, it’s highlighted in the light blue box.. This tells us the growth rate % of just hiring alone. We know how much our existing service providers did last year, we know our projections for total sales from potential new hires. That’s going to give us a growth rate percentage. If your is more than 10%, pay attention to Step 4.

Step 4
We analyze. We have a bright pink cell that shows the total sales from our existing service providers last year. Then we can see what those numbers look like at a 5-20% growth rate. This is asking, at what rate do you want to grow your existing team? This is a big priority because it’s their career. We could just solely rely on the growth rate % from new hires alone if we’re planning on hiring this year, but we have to make sure we’re growing our existing service providers because this is a massive component to retaining them. So whatever % rate you choose, make sure you gather the confidence to execute what gets to be done to progress their careers. If you have a 10% growth rate from new hires and you choose a 10% growth rate in Step 4 for your existing team, it may seem like a hefty goal.
So think about these things:
Your existing team… in general is there room for them to grow their utilisation? If you filled in their Utilisation numbers, let that be a factor in how much room there is for growth.
Do you think any of them will be going through price increases this year?
Can any of them improve their retail sales?
Can any of them start focusing on building a book with higher ticket services? Does anyone do a TON of haircuts? Can they focus on converting some of those guests to try color and increase their tickets? Can they focus on being trained in Extensions or booking more extension services?
All those points can go into thinking about what rate you choose. Fill in the yellow cell in Step 4 with your growth rate percentage.
When you have your Total Revenue Goal for the year, you’ll see your percentages for what you spent on Expenses, Payroll and Inventory from last year. The charts will spit out your Projected Profit dollar amount and percentage. This is intentional to show you, even if you make more money, if you’re spending habits and compensation structure stay the same, your profit % won’t move, your profit dollars will but the only way to increase the margin % is to improve your budgets around Expenses, Inventory and Payroll!
Last Step 4a
Once you fill in your growth rate percentage, you’ll see how this allocates service and retail revenue to each quarter.
It’s using the percentage of revenue per quarter from last year so it’s capturing your company's existing revenue patterns.
It’s using your existing retail to service percentage so those allocations are as accurate as they can be
And it’s also capturing the projected revenue from new hires in the appropriate quarters
Now if there’s anything you want to play around with, please do. See what it looks like to hire less or hire more. Or, how different yet attainable sales projections for new hires affect the numbers. See what the quarterly and monthly numbers look like at a different growth rate percentage. Play around until it feels right to you and you like the profit you’re seeing!
Now you have clear projections to start planning out how you’re going to prepare and execute and how anything new or any reviewing will be laid out for the team!

