

#11 The easiest way to increase your salon’s Utilization
Back at the beginning of the month, I did a podcast episode on my salon’s retention numbers and how I almost passed out when I saw them for the year. I’ve been in the industry for 14 years and from day one, I was taught numbers, formulas, benchmarks, and what triggers all of them.
As I opened my own salon and grew a large team, I developed a deeper understanding of numbers and even created some of my own benchmarks for salons.
Numbers aren’t new to me and I actually really enjoy them. And that’s why I was so surprised when I peeled the layers back even more specifically on retention.
Usually, when we track retention we’ll take the month we’re wanting the numbers for, and see if the guest came back within the next 12 weeks.
Example: Retention for January
You’d run a report for the guests that came in from January 1-January 31
Check to see if those guests came back in anytime from February 1-April 30th
This 12-week time frame gives the guests enough time to come back in
There’s only 1 problem with this.
At the end of the year, we would just take the average for the year but that counts for the guests that came back in over those next 3 months. Well, what if those guests in January come back after April? If so, for how long?

Learn more about our 12-month program, Rich Life CEO below. Enrollment is currently open for commission/hourly salon owners! We’ll send you instant access to real salon examples of how we’ve helped our students generate over a combined $1.2 million in additional revenue.
So I ran a report to see the total guests that came in from January-July of 2021. We saw 1,429 guests during this period. I wanted to know if those guests came back in the 2nd half of the year. I was shocked and a little sick when I landed on the numbers. 699 of them did not return for a reservation in July-December!
50% of the business we had in the first half of the year didn’t return in the 2nd half of the year. No wonder we’re always wanting to know how to fill books. We’re not keeping guests!
And I’ll add this, our average Existing Guest Retention, when we’re just looking at the next 3 months, sits around 79%. Our New Guest Retention sits at around 31%. These are very solid retention numbers according to industry benchmarks.
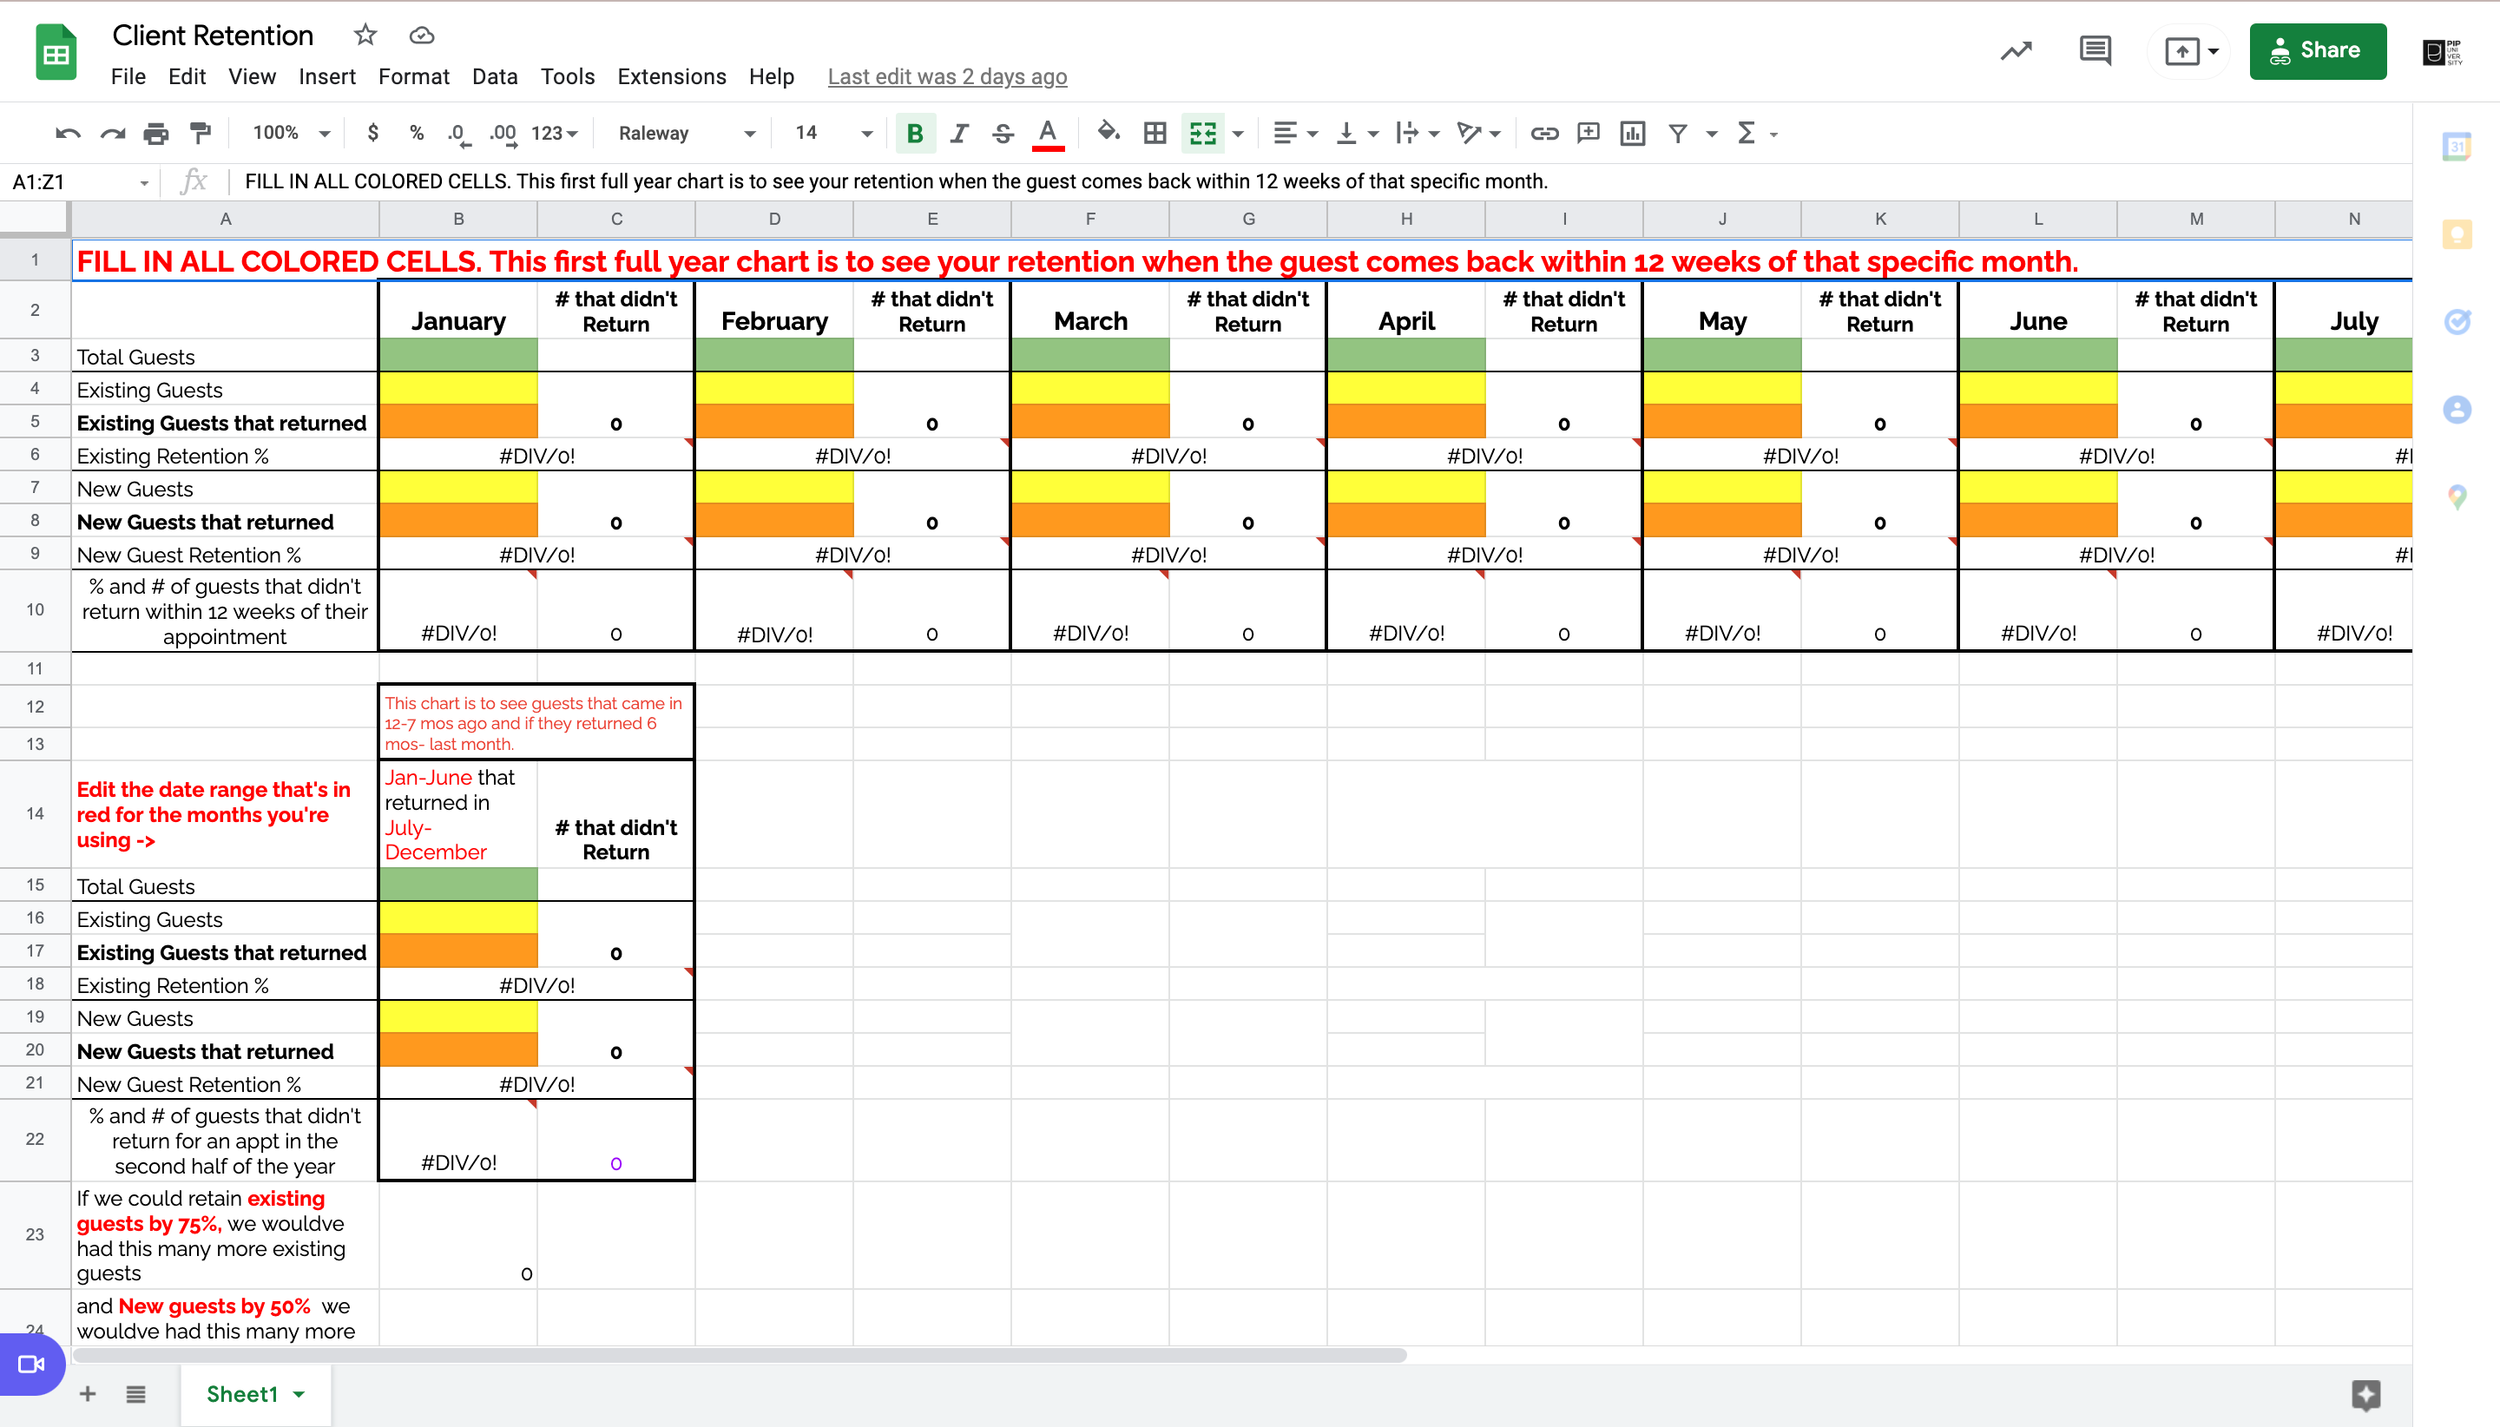
My challenge to you is to use this spreadsheet and run your numbers for the last 12 months.
In Chart 1:
Fill in your retention for the year the way we normally run it to see if the guests came back in after the 3-month time frame.
Then…
In Chart 2:
Fill in your guest count from 12 months ago to 7 months ago to see if they’ve been in within 6 months ago up until last month.
In the next blog, I'll go over the first system we’re implementing to help get this under control!